Electricity rates — California
A household in California using 1,000 kWh a month pays about $2,891 a year on the cheapest of 21 generally available plans — Residential Time of Use (R1B) from Los Angeles Department of Water & Power, in effect since April 2026, at the typical hour-by-hour use of homes in California. Schedule retrieved October 8, 2026. A further 84 restricted and 13 older schedules are priced further down but not ranked.
- Average price
- 32.9¢ per kWh
- 12 months to June 2026
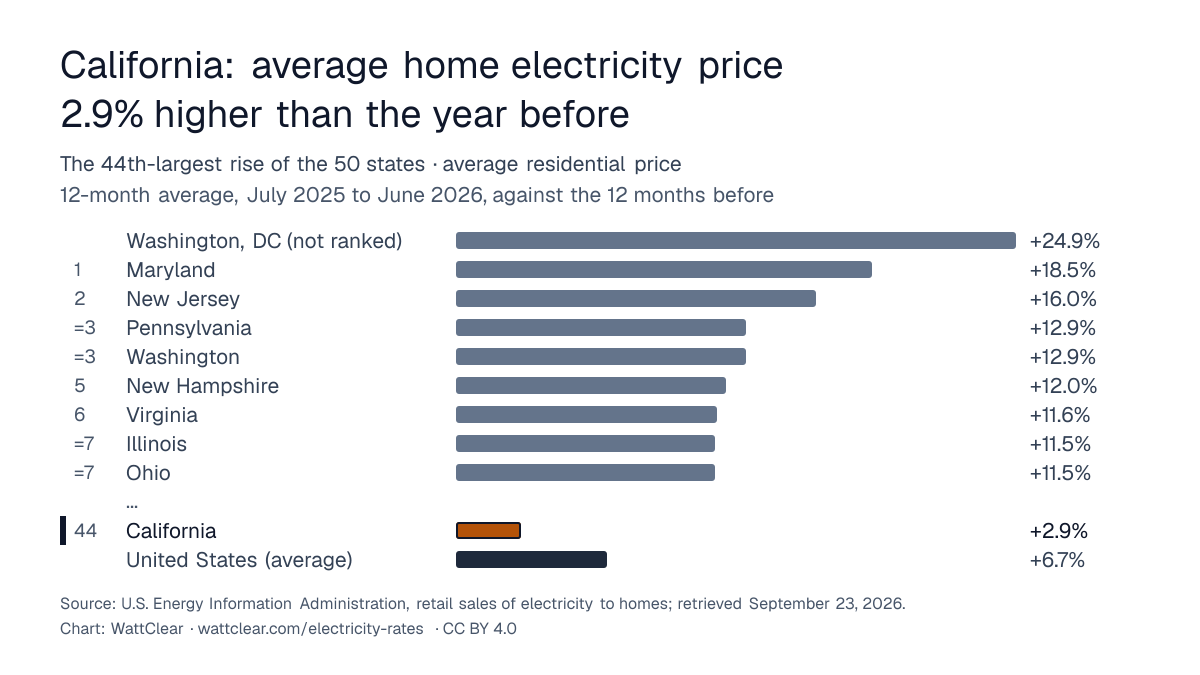
- Against the 12 months before
- +2.9%
- The 44th-largest rise of the 50 states
- Average bill
- $160 a month
- 12 months to June 2026, down 1.2% on the 12 months before, and homes used 3.9% less
56 of 149 priced plans, 1,000 kWh/mo
| Plan | Per year | vs cheapest | Effective |
|---|---|---|---|
| Residential Time of Use (R1B)✓ cheapestLos Angeles Department of Water & Powertime-of-use · in effect since April 2026 | $2,890.50 | — | 24.1¢ |
| Residential Service (R1A)Los Angeles Department of Water & Powerpriced by season · tiered · in effect since April 2026 · priced in 2 territories, up to $2,939.88; a household takes its own | $2,930.88 | +$40.38 | 24.4¢ |
| TOU-D-PRIMESouthern California Edison Cotime-of-use · in effect since June 2024 | $4,349.31 | +$1,458.81 | 36.2¢ |
| Domestic Service: D - Baseline Region 5Southern California Edison Copriced by season · tiered · in effect since June 2024 | $4,564.86 | +$1,674.36 | 38.0¢ |
| E-TOU-D Residential Time of UsePacific Gas & Electric Cotime-of-use · in effect since March 2026 | $4,566.22 | +$1,675.72 | 38.1¢ |
| Domestic Service: D - Baseline Region 15Southern California Edison Copriced by season · tiered · in effect since June 2024 | $4,582.92 | +$1,692.42 | 38.2¢ |
| Domestic Service: D - Baseline Region 13Southern California Edison Copriced by season · tiered · in effect since June 2024 | $4,648.50 | +$1,758.00 | 38.7¢ |
| E-TOU-C Residential Time of UsePacific Gas & Electric Cotime-of-use · tiered · in effect since March 2026 · priced in 10 territories, up to $4,848.39; a household takes its own | $4,676.74 | +$1,786.24 | 39.0¢ |
| Domestic Service: D - Baseline Region 10Southern California Edison Copriced by season · tiered · in effect since June 2024 | $4,684.77 | +$1,794.27 | 39.0¢ |
| Domestic Service: D - Baseline Region 14Southern California Edison Copriced by season · tiered · in effect since June 2024 | $4,690.65 | +$1,800.15 | 39.1¢ |
| Domestic Service: D - Baseline Region 9Southern California Edison Copriced by season · tiered · in effect since June 2024 | $4,715.22 | +$1,824.72 | 39.3¢ |
| Domestic Service: D - Baseline Region 16Southern California Edison Copriced by season · tiered · in effect since June 2024 | $4,731.64 | +$1,841.14 | 39.4¢ |
| E-1 -Residential ServicePacific Gas & Electric Copriced by season · tiered · in effect since March 2026 · priced in 10 territories, up to $4,960.98; a household takes its own | $4,789.31 | +$1,898.81 | 39.9¢ |
| Domestic Service: D - Baseline Region 8Southern California Edison Copriced by season · tiered · in effect since June 2024 | $4,802.80 | +$1,912.30 | 40.0¢ |
| Domestic Service: D - Baseline Region 6Southern California Edison Copriced by season · tiered · in effect since June 2024 | $4,802.88 | +$1,912.38 | 40.0¢ |
| TOU-D-5-8PMSouthern California Edison Cotime-of-use · in effect since June 2024 | $5,204.15 | +$2,313.65 | 43.4¢ |
| TOU-D-4-9PMSouthern California Edison Cotime-of-use · in effect since June 2024 | $5,224.44 | +$2,333.94 | 43.5¢ |
| TOU-DR-1San Diego Gas & Electric Cotime-of-use · tiered · in effect since June 2026 · priced in 4 territories, up to $6,062.68; a household takes its own | $5,798.91 | +$2,908.41 | 48.3¢ |
| DRSan Diego Gas & Electric Copriced by season · tiered · in effect since June 2026 · priced in 4 territories, up to $6,045.96; a household takes its own | $5,839.65 | +$2,949.15 | 48.7¢ |
| TOU-DR-2San Diego Gas & Electric Cotime-of-use · tiered · in effect since June 2026 · priced in 4 territories, up to $6,061.94; a household takes its own | $5,903.25 | +$3,012.75 | 49.2¢ |
| TOU-DRSan Diego Gas & Electric Cotime-of-use · tiered · in effect since June 2026 · priced in 4 territories, up to $6,090.38; a household takes its own | $5,931.54 | +$3,041.04 | 49.4¢ |
| Priced but not ranked — restricted, older, or not verifiable as a bill | |||
| Residential Smart Pricing Pilot Weekday Value Plan - Single Phase (Closed)Sacramento Municipal Utility Districttime-of-use · in effect since January 2017 · closed to new customers | $1,569.57 | −$1,320.93 | 13.1¢ |
| Residential Lifeline Rate DiscountCity of Redding, California (Utility Company)tiered · in effect since January 2016 · lifeline rate | $1,620.36 | −$1,270.14 | 13.5¢ |
| Residential TOD (Option B - Currently Closed)Sacramento Municipal Utility Districttime-of-use · in effect since January 2018 · closed to new customers | $1,738.27 | −$1,152.23 | 14.5¢ |
| Residential ServiceCity of Redding, California (Utility Company)flat rate · in effect since January 2016 · older schedule, not ranked | $2,032.08 | −$858.42 | 16.9¢ |
93 further schedules are published and priced but not listed here — mostly regional and seasonal variants of the plans above. The dearest of them costs $8,759.03 a year at this usage.
The cheapest plan in California at each level of use
- 500 kWh/mo — cheapest $1,450.44 (Residential Service (R1A): Zone 2), dearest $3,012.55, a $1,562.11 spread
- 1,000 kWh/mo — cheapest $2,890.50 (Residential Time of Use (R1B)), dearest $6,090.38, a $3,199.88 spread
- 2,000 kWh/mo — cheapest $5,684.97 (Residential Time of Use (R1B)), dearest $12,263.52, a $6,578.55 spread
What a typical bill in California costs
At 1,000 kWh a month the 52 generally available plans here run from $2,890.50 on Residential Time of Use (R1B) to $6,090.38 on TOU-DR Coastal Baseline Region, with a median of $4,839.46.
Effective rates span 24.1¢ to 50.8¢ per kWh at that usage.
What households in California pay, by EIA's count
California's residential electricity averaged 32.9¢ per kWh over the 12 months to June 2026, the 2nd-highest of the 50 states and DC and 84% above the US average of 17.9¢. It sits between Massachusetts (30.4¢) and Hawaii (42.7¢).
EIA lists 32 utilities serving homes in California. By homes served, the largest 5 are Pacific Gas & Electric Co. (5,047,461), Southern California Edison Co (4,594,415), Los Angeles Department of Water & Power (1,410,191), San Diego Gas & Electric Co (1,364,361), and Sacramento Municipal Util Dist (592,557). Municipal utilities supply about 15% and public power districts supply about 7% of its households.
Over five years they rose 52.9%, well ahead of the US's 34.7%.
California homes used the most electricity in August and the least in April (2021–2025): a summer peak, 1.8 times the lightest month. August's bills were the highest, averaging $198; April's the lowest, $114. June was the dearest month per kWh, 13% above January.
The utilities with a ranked plan on this page serve about 91% of California's households: Pacific Gas & Electric Co (5,047,461), Southern California Edison Co (4,594,415), Los Angeles Department of Water & Power (1,410,191), San Diego Gas & Electric Co (1,364,361). Their median plan at 1,000 kWh a month works out to 40.3¢ per kWh, 23% above EIA's average, which is why this page compares that median with other states'.
| Average price, 12 months to June 2026 | 32.9¢ |
|---|---|
| Among the 50 states and DC | 50 of 51, 1 = lowest |
| US average, same months | 17.9¢ |
| Change on the 12 months before | ↑ +2.9% |
| Change over five years | ↑ +52.9% (US ↑ +34.7%) |
| Average price in 2001 | 12.1¢ |
| Households, 2024 | 13,582,820 |
| Average use per home, 2024 | 527 kWh a month (US 872) |
| Average bill per home, 2024 | $168.37 a month (US $143.64) |
Chart of this for reuse (PNG), free to republish under CC BY 4.0 with credit to WattClear. Suggested alt text: “Bar chart. California's average home electricity price, July 2025 to June 2026, was 2.9% higher than the 12 months before, the 44th-largest rise of the 50 states. Washington, DC: +24.9%. United States average: +6.7%. Source: U.S. Energy Information Administration.”
Every year’s figure for California
| Year | California | US |
|---|---|---|
| 2025 | 32.5¢ | 17.3¢ |
| 2024 | 32.0¢ | 16.5¢ |
| 2023 | 29.5¢ | 16.0¢ |
| 2022 | 25.8¢ | 15.0¢ |
| 2021 | 22.8¢ | 13.7¢ |
| 2020 | 20.4¢ | 13.2¢ |
| 2019 | 19.2¢ | 13.0¢ |
| 2018 | 18.8¢ | 12.9¢ |
| 2017 | 18.3¢ | 12.9¢ |
| 2016 | 17.4¢ | 12.5¢ |
| 2015 | 17.0¢ | 12.7¢ |
| 2014 | 16.2¢ | 12.5¢ |
| 2013 | 16.2¢ | 12.1¢ |
| 2012 | 15.3¢ | 11.9¢ |
| 2011 | 14.8¢ | 11.7¢ |
| 2010 | 14.8¢ | 11.5¢ |
| 2009 | 14.7¢ | 11.5¢ |
| 2008 | 13.8¢ | 11.3¢ |
| 2007 | 14.4¢ | 10.7¢ |
| 2006 | 14.3¢ | 10.4¢ |
| 2005 | 12.5¢ | 9.4¢ |
| 2004 | 12.2¢ | 8.9¢ |
| 2003 | 12.2¢ | 8.7¢ |
| 2002 | 12.6¢ | 8.4¢ |
| 2001 | 12.1¢ | 8.6¢ |
Highest in August, $198; lowest in April, $114.
Every month’s bill in California
| Month | Average bill |
|---|---|
| January | $146 |
| February | $125 |
| March | $127 |
| April | $114 |
| May | $121 |
| June | $145 |
| July | $187 |
| August | $198 |
| September | $183 |
| October | $135 |
| November | $123 |
| December | $133 |
In the guides: Summer and winter bills, state by state
How California compares
At 1,000 kWh a month the median plan in California costs $4,839.46 a year: the highest of the 30 states whose indexed plans stand for them, and 2.1× as much as their median of $2,303.60. Next down is Hawaii ($4,429.60).
Its cheapest open plan, Residential Time of Use (R1B) from Los Angeles Department of Water & Power at $2,890.50, is the 7th-highest of the 30 states' cheapest plans.
101 of its 149 priceable plans price by the hour, the 5th-largest share of any state here.
The largest fixed charge on any plan here is $62.95 a month, the 4th-largest such charge of the 30 states.
In the guides: What published electricity plans cost, state by state · What a plan charges by the hour, and what moving a kilowatt-hour is worth · What a bill costs before a single kilowatt-hour
What each provider in California costs
4 utilities serve customers across California in this data. At 1,000 kWh a month the cheapest of them is Los Angeles Department of Water & Power at $2,890.50 a year on Residential Time of Use (R1B); the dearest is San Diego Gas & Electric Co at $5,798.91.
That is $2,908.41 a year between the best each provider offers.
Cheapest available plan by provider: Los Angeles Department of Water & Power $2,890.50; Southern California Edison Co $4,349.31; Pacific Gas & Electric Co $4,566.22; San Diego Gas & Electric Co $5,798.91.
Which plan in California is cheapest as use rises
The cheapest plan in California changes with consumption. At 500 kWh a month Residential Service (R1A): Zone 2 wins at $1,450.44 a year; at 2,000 kWh Residential Time of Use (R1B) wins at $5,684.97.
The penalty for a poor choice grows with usage: $1,562.11 a year at 500 kWh against $6,578.55 at 2,000 kWh.
How California's plans are structured
Of 149 priceable plans: 116 tiered, 101 time-of-use, 46 priced by season, 1 with demand charges, 1 flat-rate.
Fixed monthly charges run from $0.79 to $62.95.
Who provides California's plans
These plans come from 7 utilities: City & County of San Francisco (Utility Company), City of Redding, California (Utility Company), Los Angeles Department of Water & Power, Pacific Gas & Electric Co, Sacramento Municipal Utility District, San Diego Gas & Electric Co, Southern California Edison Co.
The largest saving among California's plans
Moving from TOU-DR Coastal Baseline Region to Residential Time of Use (R1B) saves $3,199.88 a year at 1,000 kWh a month, with no change in consumption.
What the California figures do not cover
101 of these plans price by the hour; their figures assume the typical hourly pattern of homes in California, not this household's own hours.