Electricity rates by state
Over the twelve months to June 2026, US homes paid an average of 17.9¢ per kWh, up 6.7% on the twelve months before, and $156 a month. North Dakota was the cheapest at 12.3¢ and Hawaii the dearest at 42.7¢; prices rose in 48 of the 51.
A price is not a bill. The largest average bill was in Hawaii, at $220 a month for 514 kWh; the smallest in New Mexico, at $98. Every figure is the EIA’s count of what homes were billed, riders and every utility in the state included, not any one plan’s rate.
| Rank | State | 12-month price | On a year before | June 2026 | Average bill | Average use |
|---|---|---|---|---|---|---|
| — | United States | 17.9¢ | ↑ +6.7% | 18.3¢ | $156 | 870 kWh |
| 1 | Hawaii | 42.7¢ | ↑ +3.0% | 52.7¢ | $220 | 514 kWh |
| 2 | California | 32.9¢ | ↑ +2.9% | 34.7¢ | $160 | 487 kWh |
| 3 | Massachusetts | 30.4¢ | ↑ +1.3% | 29.6¢ | $183 | 603 kWh |
| 4 | Rhode Island | 29.0¢ | ↓ −0.2% | 29.2¢ | $164 | 564 kWh |
| 5 | Maine | 29.0¢ | ↑ +11% | 29.6¢ | $156 | 538 kWh |
| 6 | Connecticut | 28.4¢ | ↓ −6.1% | 24.3¢ | $201 | 708 kWh |
| 7 | New York | 28.0¢ | ↑ +10.0% | 29.5¢ | $165 | 592 kWh |
| 8 | Alaska | 26.7¢ | ↑ +5.2% | 28.2¢ | $157 | 587 kWh |
| 9 | New Hampshire | 26.3¢ | ↑ +12% | 27.0¢ | $169 | 645 kWh |
| 10 | Washington, DC | 24.0¢ | ↑ +25% | 24.4¢ | $152 | 633 kWh |
| 11 | New Jersey | 23.8¢ | ↑ +16% | 25.0¢ | $160 | 672 kWh |
| 12 | Vermont | 23.7¢ | ↑ +5.4% | 24.4¢ | $141 | 595 kWh |
| 13 | Maryland | 21.8¢ | ↑ +18% | 21.8¢ | $207 | 951 kWh |
| 14 | Michigan | 20.7¢ | ↑ +6.4% | 23.0¢ | $131 | 629 kWh |
| 15 | Pennsylvania | 20.5¢ | ↑ +13% | 21.7¢ | $173 | 846 kWh |
| 16 | Wisconsin | 18.6¢ | ↑ +6.1% | 19.6¢ | $123 | 660 kWh |
| 17 | Illinois | 18.5¢ | ↑ +11% | 19.9¢ | $131 | 706 kWh |
| 18 | Ohio | 18.0¢ | ↑ +11% | 19.2¢ | $157 | 873 kWh |
| 19 | Delaware | 17.6¢ | ↑ +5.2% | 19.3¢ | $166 | 944 kWh |
| 20 | Indiana | 16.9¢ | ↑ +9.7% | 17.5¢ | $159 | 942 kWh |
| 21 | Colorado | 16.5¢ | ↑ +7.5% | 17.1¢ | $110 | 668 kWh |
| 22 | Alabama | 16.4¢ | ↑ +5.1% | 16.4¢ | $185 | 1,127 kWh |
| 23 | Virginia | 16.3¢ | ↑ +12% | 17.2¢ | $172 | 1,057 kWh |
| 24 | Minnesota | 16.2¢ | ↑ +4.1% | 17.5¢ | $119 | 738 kWh |
| 25 | Texas | 15.9¢ | ↑ +4.9% | 15.9¢ | $174 | 1,095 kWh |
| 26 | South Carolina | 15.6¢ | ↑ +6.1% | 15.6¢ | $164 | 1,058 kWh |
| 27 | Oregon | 15.5¢ | ↑ +3.1% | 16.3¢ | $132 | 853 kWh |
| 28 | West Virginia | 15.5¢ | ↑ +0.6% | 15.5¢ | $164 | 1,064 kWh |
| 29 | Florida | 15.4¢ | ↑ +6.6% | 15.1¢ | $168 | 1,094 kWh |
| 30 | Arizona | 15.4¢ | ↑ +2.2% | 15.2¢ | $161 | 1,048 kWh |
| 31 | New Mexico | 15.3¢ | ↑ +5.3% | 15.1¢ | $98 | 644 kWh |
| 32 | Georgia | 15.0¢ | ↑ +4.3% | 16.4¢ | $161 | 1,071 kWh |
| 33 | Kansas | 15.0¢ | ↑ +4.2% | 15.7¢ | $130 | 870 kWh |
| 34 | Mississippi | 14.7¢ | ↑ +7.5% | 14.9¢ | $170 | 1,160 kWh |
| 35 | North Carolina | 14.6¢ | ↑ +4.1% | 14.7¢ | $151 | 1,034 kWh |
| 36 | South Dakota | 14.1¢ | ↑ +7.7% | 15.4¢ | $138 | 981 kWh |
| 37 | Iowa | 14.0¢ | ↑ +4.4% | 15.9¢ | $119 | 849 kWh |
| 38 | Wyoming | 14.0¢ | ↑ +8.7% | 15.2¢ | $114 | 810 kWh |
| 39 | Washington | 14.0¢ | ↑ +13% | 14.9¢ | $131 | 933 kWh |
| 40 | Missouri | 13.9¢ | ↑ +6.1% | 16.2¢ | $145 | 1,045 kWh |
| 41 | Kentucky | 13.8¢ | ↑ +6.5% | 14.3¢ | $155 | 1,116 kWh |
| 42 | Montana | 13.8¢ | ↑ +9.6% | 15.1¢ | $113 | 823 kWh |
| 43 | Oklahoma | 13.6¢ | ↑ +7.4% | 14.3¢ | $142 | 1,046 kWh |
| 44 | Tennessee | 13.5¢ | ↑ +4.7% | 14.1¢ | $163 | 1,205 kWh |
| 45 | Utah | 13.4¢ | ↑ +5.6% | 13.4¢ | $102 | 763 kWh |
| 46 | Nevada | 13.3¢ | ↓ −3.7% | 13.1¢ | $117 | 877 kWh |
| 47 | Arkansas | 13.3¢ | ↑ +6.8% | 14.1¢ | $140 | 1,048 kWh |
| 48 | Louisiana | 13.0¢ | ↑ +7.4% | 13.5¢ | $156 | 1,198 kWh |
| 49 | Nebraska | 12.8¢ | ↑ +7.3% | 13.3¢ | $122 | 956 kWh |
| 50 | Idaho | 12.5¢ | ↑ +7.7% | 14.4¢ | $112 | 899 kWh |
| 51 | North Dakota | 12.3¢ | ↑ +6.7% | 14.1¢ | $131 | 1,064 kWh |
Use this data
Download the table as CSV (51 rows and the US). It is rebuilt each month from the EIA’s release. Please cite it as:
WattClear, "Electricity rates by state", https://wattclear.com/electricity-rates, from U.S. Energy Information Administration retail sales data, July 2025 to June 2026 (retrieved September 23, 2026).
Chart of the largest rises (PNG), and one for each state on its page. Suggested alt text: “Bar chart of the 10 states whose average home electricity price rose most, July 2025 to June 2026 against the 12 months before. The largest rise was Maryland's, +18.5%. United States average: +6.7%. Source: U.S. Energy Information Administration.”
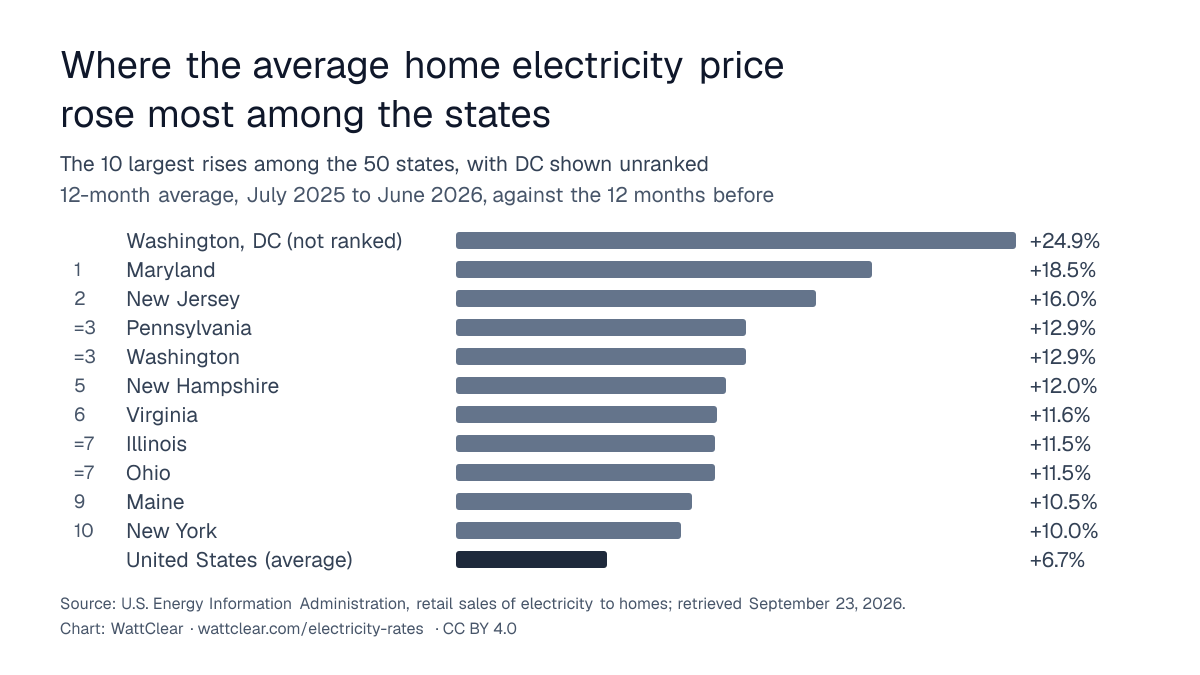
The table, the CSV and the charts are CC BY 4.0: republish them with credit to WattClear and a link to this page, which may be nofollow.
To show one state’s figures on your own site, kept up to date, embed its box.
Plans priced in each state
Each state’s page prices the published plans of the utilities found there, beside the figures above. A state appears once plans from at least one of its utilities have been placed in it.
Not every utility. 1211 tariffs from 217 utilities, retrieved up to October 8, 2026. A utility missing here is one that has not been indexed yet.
California
From $2,890.50 a year at 1,000 kWh a month, across 149 priced plans.
38 computed facts · 7 utilities
New York
From $2,185.58 a year at 1,000 kWh a month, across 83 priced plans.
39 computed facts · 6 utilities
Arizona
From $1,607.17 a year at 1,000 kWh a month, across 67 priced plans.
36 computed facts · 3 utilities
Michigan
From $1,915.77 a year at 1,000 kWh a month, across 65 priced plans.
34 computed facts · 7 utilities
Massachusetts
From $3,116.40 a year at 1,000 kWh a month, across 51 priced plans.
32 computed facts · 2 utilities
Washington
From $1,410.41 a year at 1,000 kWh a month, across 42 priced plans.
36 computed facts · 6 utilities
South Carolina
From $1,756.80 a year at 1,000 kWh a month, across 33 priced plans.
37 computed facts · 7 utilities
Illinois
From $1,750.64 a year at 1,000 kWh a month, across 33 priced plans.
35 computed facts · 4 utilities
Texas
From $1,486.32 a year at 1,000 kWh a month, across 32 priced plans.
39 computed facts · 12 utilities
Minnesota
From $1,945.43 a year at 1,000 kWh a month, across 30 priced plans.
35 computed facts · 6 utilities
South Dakota
From $2,130.72 a year at 1,000 kWh a month, across 32 priced plans.
31 computed facts · 9 utilities
Missouri
From $1,406.35 a year at 1,000 kWh a month, across 32 priced plans.
37 computed facts · 8 utilities
North Carolina
From $1,449.36 a year at 1,000 kWh a month, across 30 priced plans.
39 computed facts · 5 utilities
Wisconsin
From $1,931.60 a year at 1,000 kWh a month, across 29 priced plans.
35 computed facts · 4 utilities
Georgia
From $1,381.37 a year at 1,000 kWh a month, across 23 priced plans.
35 computed facts · 6 utilities
Kentucky
From $1,500.52 a year at 1,000 kWh a month, across 22 priced plans.
35 computed facts · 7 utilities
Colorado
From $1,686.22 a year at 1,000 kWh a month, across 20 priced plans.
34 computed facts · 4 utilities
New Jersey
From $2,423.04 a year at 1,000 kWh a month, across 20 priced plans.
35 computed facts · 2 utilities
North Dakota
19 computed facts · 5 utilities
Ohio
From $2,215.31 a year at 1,000 kWh a month, across 18 priced plans.
35 computed facts · 4 utilities
Alabama
From $1,516.56 a year at 1,000 kWh a month, across 17 priced plans.
35 computed facts · 4 utilities
Tennessee
From $1,680.72 a year at 1,000 kWh a month, across 16 priced plans.
35 computed facts · 8 utilities
Wyoming
From $1,751.88 a year at 1,000 kWh a month, across 16 priced plans.
33 computed facts · 4 utilities
Maryland
From $2,835.05 a year at 1,000 kWh a month, across 16 priced plans.
33 computed facts · 3 utilities
Oregon
From $1,872.48 a year at 1,000 kWh a month, across 16 priced plans.
34 computed facts · 3 utilities
Kansas
From $1,269.91 a year at 1,000 kWh a month, across 14 priced plans.
34 computed facts · 3 utilities
Nebraska
From $1,113.60 a year at 1,000 kWh a month, across 13 priced plans.
32 computed facts · 4 utilities
Mississippi
From $1,528.56 a year at 1,000 kWh a month, across 11 priced plans.
33 computed facts · 7 utilities
Washington, DC
From $2,332.96 a year at 1,000 kWh a month, across 13 priced plans.
29 computed facts · 1 utility
Pennsylvania
From $2,346.48 a year at 1,000 kWh a month, across 13 priced plans.
34 computed facts · 3 utilities
Hawaii
From $4,259.84 a year at 1,000 kWh a month, across 12 priced plans.
31 computed facts · 2 utilities
Utah
From $1,641.56 a year at 1,000 kWh a month, across 12 priced plans.
31 computed facts · 1 utility
Oklahoma
18 computed facts · 4 utilities
Nevada
From $1,612.64 a year at 1,000 kWh a month, across 10 priced plans.
31 computed facts · 1 utility
Florida
From $1,596.72 a year at 1,000 kWh a month, across 10 priced plans.
37 computed facts · 3 utilities
Maine
From $3,444.84 a year at 1,000 kWh a month, across 10 priced plans.
30 computed facts · 1 utility
Louisiana
From $1,391.52 a year at 1,000 kWh a month, across 9 priced plans.
35 computed facts · 4 utilities
New Hampshire
From $2,933.04 a year at 1,000 kWh a month, across 9 priced plans.
31 computed facts · 1 utility
Virginia
From $2,022.36 a year at 1,000 kWh a month, across 8 priced plans.
33 computed facts · 1 utility
Vermont
From $2,698.45 a year at 1,000 kWh a month, across 8 priced plans.
31 computed facts · 1 utility
Connecticut
From $3,592.88 a year at 1,000 kWh a month, across 8 priced plans.
30 computed facts · 1 utility
Indiana
From $1,876.32 a year at 1,000 kWh a month, across 7 priced plans.
35 computed facts · 3 utilities
Iowa
From $2,094.81 a year at 1,000 kWh a month, across 6 priced plans.
32 computed facts · 1 utility
Montana
16 computed facts · 2 utilities
Alaska
15 computed facts · 4 utilities
New Mexico
From $2,121.42 a year at 1,000 kWh a month, across 4 priced plans.
33 computed facts · 2 utilities
Rhode Island
From $3,047.52 a year at 1,000 kWh a month, across 4 priced plans.
26 computed facts · 1 utility
Delaware
17 computed facts · 1 utility
Arkansas
16 computed facts · 1 utility
Idaho
From $1,321.82 a year at 1,000 kWh a month, across 2 priced plans.
25 computed facts · 1 utility
West Virginia
From $1,649.16 a year at 1,000 kWh a month, across 1 priced plans.
20 computed facts · 1 utility