Electricity rates — Kentucky
EIA puts the average residential price in Kentucky at 13.8¢ per kWh over the 12 months to June 2026, the 11th-lowest of 51 against 17.9¢ for the US. The 5 ranked plans below come from utilities serving about 25% of its homes, so they are listed, not presented as the state's price. Retrieved September 23, 2026.
- Average price
- 13.8¢ per kWh
- 12 months to June 2026
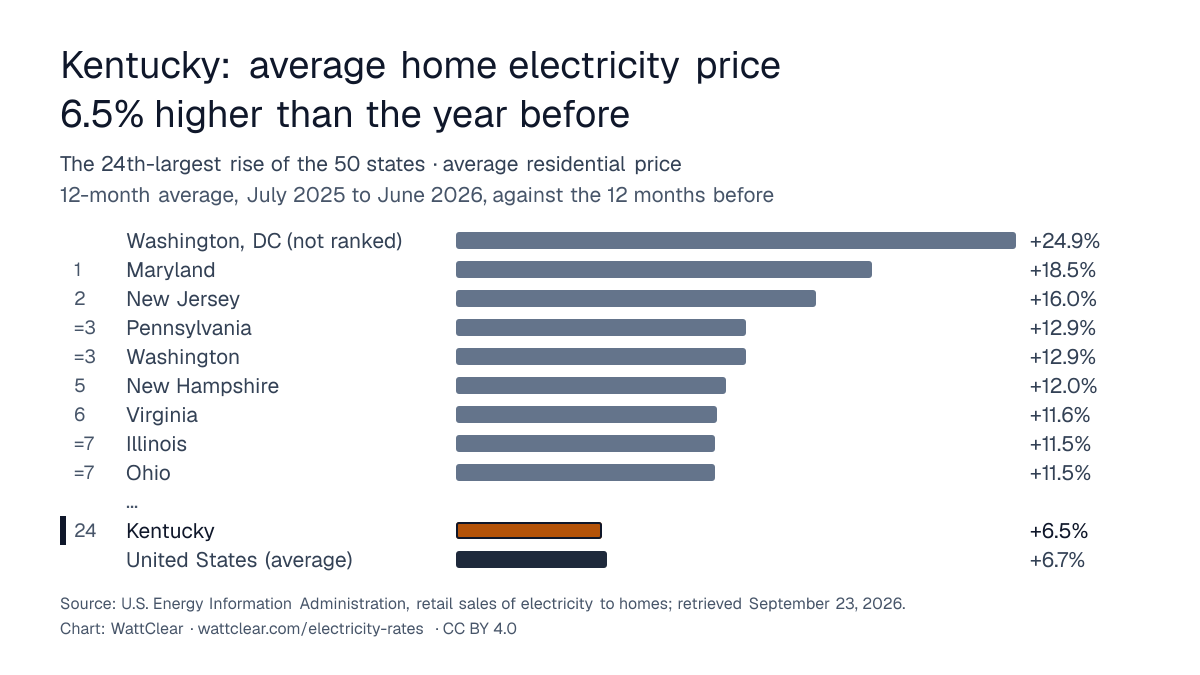
- Against the 12 months before
- +6.5%
- The 24th-largest rise of the 50 states
- Average bill
- $155 a month
- 12 months to June 2026, up 9.1% on the 12 months before, and homes used 2.5% more
Every priced plan in Kentucky, 1,000 kWh/mo
| Plan | Per year | vs cheapest | Effective |
|---|---|---|---|
| Residential Time-of-Day Energy Service✓ cheapestLouisville Gas & Electric Cotime-of-use · in effect since December 2025 | $1,500.52 | — | 12.5¢ |
| RS - Residential ServiceLouisville Gas & Electric Coflat rate · in effect since December 2025 | $1,519.71 | +$19.19 | 12.7¢ |
| Residential Service - RSKentucky Power Coflat rate · in effect since April 2026 | $1,771.32 | +$270.80 | 14.8¢ |
| Residential Service Load Management - Time of Day - RSLMTODKentucky Power Cotime-of-use · in effect since April 2026 | $1,829.27 | +$328.75 | 15.2¢ |
| Residential Time-of-Day Service - RSTODKentucky Power Cotime-of-use · in effect since April 2026 | $1,829.27 | +$328.75 | 15.2¢ |
| Priced but not ranked — restricted, older, or not verifiable as a bill | |||
| Schedule A5- Farm & Home ServiceSalt River Electric Coop Corpflat rate · in effect since March 2017 · farm or irrigation service | $971.64 | −$528.88 | 8.1¢ |
| Schedule A5- Farm & Home Service TOD Option BSalt River Electric Coop Corptime-of-use · in effect since March 2017 · farm or irrigation service | $979.75 | −$520.77 | 8.2¢ |
| Schedule A5- Farm & Home Service TOD Option ASalt River Electric Coop Corptime-of-use · in effect since March 2017 · farm or irrigation service | $1,016.35 | −$484.17 | 8.5¢ |
| GS-3 (Residential and Farm Time-of-Day Rate)Blue Grass Energy Coop Corptime-of-use · in effect since February 2017 · a general-service class | $1,089.77 | −$410.75 | 9.1¢ |
| Residential Time-of-Day Demand ServiceLouisville Gas & Electric Codemand charge · in effect since December 2025 · billed on peak kW, which monthly use cannot price; not ranked | $1,162.23 | −$338.29 | 9.7¢ |
| GS 1- Residential & FarmBlue Grass Energy Coop Corpflat rate · in effect since February 2017 · farm or irrigation service | $1,173.96 | −$326.56 | 9.8¢ |
| Residential Service- Off Peak(Schedule 11)Jackson Energy Coop Corptime-of-use · in effect since February 2016 · older schedule, not ranked | $1,203.91 | −$296.61 | 10.0¢ |
| Schedule 1-B3 - Farm and Home - TODOwen Electric Coop Inctime-of-use · in effect since September 2017 · farm or irrigation service | $1,240.81 | −$259.71 | 10.3¢ |
| Schedule 1-B1 - Farm & Home - TODOwen Electric Coop Inctime-of-use · in effect since September 2017 · farm or irrigation service | $1,241.31 | −$259.21 | 10.3¢ |
| Schedule 1-B2 - Farm and Home - TODOwen Electric Coop Inctime-of-use · in effect since September 2017 · farm or irrigation service | $1,242.19 | −$258.33 | 10.4¢ |
| Schedule I - ResidentialOwen Electric Coop Incflat rate · in effect since October 2021 · older schedule, not ranked | $1,251.48 | −$249.04 | 10.4¢ |
| ResidentialJackson Energy Coop Corpflat rate · no start date · older schedule, not ranked | $1,307.16 | −$193.36 | 10.9¢ |
| ResidentialWarren Rural Elec Coop Corppriced by season · in effect since October 2016 · older schedule, not ranked | $1,322.72 | −$177.80 | 11.0¢ |
| Schedule 1-D - Farm & Home Inclining Block RateOwen Electric Coop Inctiered · in effect since September 2017 · farm or irrigation service | $1,344.24 | −$156.28 | 11.2¢ |
| Residential Service (Schedule 10)Jackson Energy Coop Corpflat rate · in effect since February 2016 · older schedule, not ranked | $1,379.16 | −$121.36 | 11.5¢ |
| Residential Demand-Metered Service - RSDKentucky Power Cotime-of-use · demand charge · in effect since April 2026 · billed on peak kW, which monthly use cannot price; not ranked | $1,498.91 | −$1.61 | 12.5¢ |
| Experimental Residential Time-of-Day 2 Service - RSTOD2Kentucky Power Cotime-of-use · in effect since April 2026 · experimental | $1,839.00 | +$338.48 | 15.3¢ |
The cheapest plan in Kentucky at each level of use
- 500 kWh/mo — cheapest $887.15 (Residential Time-of-Day Energy Service), dearest $1,052.63, a $165.48 range
- 1,000 kWh/mo — cheapest $1,500.52 (Residential Time-of-Day Energy Service), dearest $1,829.27, a $328.75 range
- 2,000 kWh/mo — cheapest $2,727.32 (Residential Time-of-Day Energy Service), dearest $3,382.48, a $655.16 range
What households in Kentucky pay, by EIA's count
Kentucky sits between Montana (13.8¢) and Missouri (13.9¢).
EIA lists 45 utilities serving homes in Kentucky. By homes served, the largest 5 are Kentucky Utilities Co (450,673), Louisville Gas & Electric Co (384,902), Duke Energy Kentucky (139,405), Kentucky Power Co (130,852), and South Kentucky Rural E C C (64,877). Member-owned cooperatives supply about 38% and municipal utilities supply about 7% of its households.
Kentucky homes used the most electricity in January and the least in April (2021–2025): a winter peak, 1.7 times the lightest month. November was the dearest month per kWh, 13% above February.
The utilities with a ranked plan on this page serve about 25% of Kentucky's households: Louisville Gas & Electric Co (384,902), Kentucky Power Co (130,852). That is less than half the state, so the plans below describe those utilities, not Kentucky; EIA's figure is the state's. Their median plan at 1,000 kWh a month works out to 14.8¢ per kWh.
| Average price, 12 months to June 2026 | 13.8¢ |
|---|---|
| Among the 50 states and DC | 11 of 51, 1 = lowest |
| US average, same months | 17.9¢ |
| Change on the 12 months before | ↑ +6.5% |
| Change over five years | ↑ +26.1% (US ↑ +34.7%) |
| Average price in 2001 | 5.6¢ |
| Households, 2024 | 2,077,215 |
| Average use per home, 2024 | 1,047 kWh a month (US 872) |
| Average bill per home, 2024 | $133.81 a month (US $143.64) |
Chart of this for reuse (PNG), free to republish under CC BY 4.0 with credit to WattClear.
Every year’s figure for Kentucky
| Year | Kentucky | US |
|---|---|---|
| 2025 | 13.2¢ | 17.3¢ |
| 2024 | 12.8¢ | 16.5¢ |
| 2023 | 12.7¢ | 16.0¢ |
| 2022 | 12.9¢ | 15.0¢ |
| 2021 | 11.5¢ | 13.7¢ |
| 2020 | 10.9¢ | 13.2¢ |
| 2019 | 10.8¢ | 13.0¢ |
| 2018 | 10.6¢ | 12.9¢ |
| 2017 | 10.9¢ | 12.9¢ |
| 2016 | 10.5¢ | 12.5¢ |
| 2015 | 10.2¢ | 12.7¢ |
| 2014 | 10.2¢ | 12.5¢ |
| 2013 | 9.8¢ | 12.1¢ |
| 2012 | 9.4¢ | 11.9¢ |
| 2011 | 9.2¢ | 11.7¢ |
| 2010 | 8.6¢ | 11.5¢ |
| 2009 | 8.4¢ | 11.5¢ |
| 2008 | 7.9¢ | 11.3¢ |
| 2007 | 7.3¢ | 10.7¢ |
| 2006 | 7.0¢ | 10.4¢ |
| 2005 | 6.6¢ | 9.4¢ |
| 2004 | 6.1¢ | 8.9¢ |
| 2003 | 5.8¢ | 8.7¢ |
| 2002 | 5.6¢ | 8.4¢ |
| 2001 | 5.6¢ | 8.6¢ |
Highest in July, $172; lowest in April, $104.
Every month’s bill in Kentucky
| Month | Average bill |
|---|---|
| January | $167 |
| February | $142 |
| March | $120 |
| April | $104 |
| May | $110 |
| June | $139 |
| July | $172 |
| August | $165 |
| September | $129 |
| October | $107 |
| November | $117 |
| December | $148 |
In the guides: Summer and winter bills, state by state
What each provider in Kentucky costs
2 utilities serve customers across Kentucky in this data. At 1,000 kWh a month the cheapest of them is Louisville Gas & Electric Co at $1,500.52 a year on Residential Time-of-Day Energy Service; the dearest is Kentucky Power Co at $1,771.32.
That is $270.80 a year between the best each provider offers.
Cheapest available plan by provider: Louisville Gas & Electric Co $1,500.52; Kentucky Power Co $1,771.32.
How Kentucky's plans are structured
Of 22 priceable plans: 1 tiered, 12 time-of-use, 1 priced by season, 2 with demand charges, 7 flat-rate.
Fixed monthly charges run from $8.84 to $25.00.
Who provides Kentucky's plans
These plans come from 7 utilities: Blue Grass Energy Coop Corp, Jackson Energy Coop Corp, Kentucky Power Co, Louisville Gas & Electric Co, Owen Electric Coop Inc, Salt River Electric Coop Corp, Warren Rural Elec Coop Corp.